



Peculiarities of video ad performance
Video ads don’t play by the same rules as banners, push ads, popunders, or native ads. A 15-30 second video can show a product in action, build an emotional connection, engage and entertain a user, and convince them to click, or at least remember the brand for a long time.
If your offer needs a bit of explanation, video is your top format choice. At the same time, you can use video ads for quick conversions as well. It all depends on the approach and the type of video you use.
Video comes in many forms, and each one behaves differently:
- In-stream video ads (pre-roll, mid-roll, post-roll) are placed inside a video player and get 100% viewability.
- Out-stream ads are shown in an article, feed, or banner slot and work best for brand awareness.
- Rewarded video, where users trade a view for an in-app reward, ensures the highest completion rate.
- Interstitial video ads play between app screens, delivering large volumes of mobile video traffic.
- Native video is blended into a feed and delivers better click quality due to a high-intent audience.
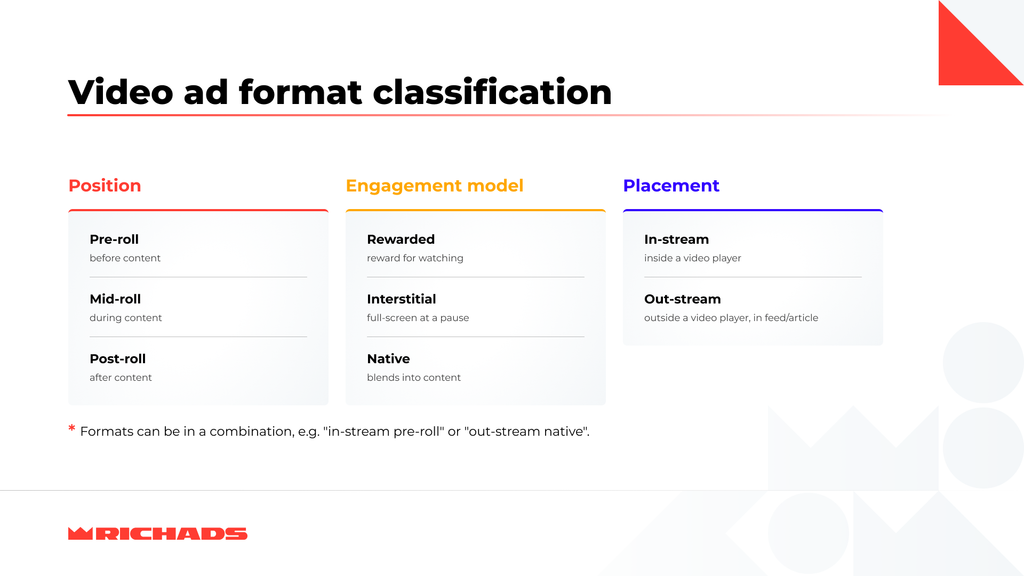
Overall, the performance of online video ads is better than other formats if you match the type to the offer and your CPA goals.
What is RichAds?
Ad network for telegram ads,
high quality push and popunder ads,
domain redirect, native and display traffic source,
buy push ads at $0.005 (CPC), pop ads at $0.5 (CPM),
domain ads costs start from $1.5 (CPM), native ads — from $0.001 (CPC),
ad network offers large volumes of traffic in more than 200 geos from Tier 3 to Tier 1.
Key video ad metrics to track
The most obvious factor distinguishing video advertising from other formats is the metrics. To measure the performance of online video ads, you should look not just at standard metrics like CTR or CR, but also at video-specific ones such as viewability and skip rate.
Impressions
Impressions count how many times your video ad was served or shown to a viewer, regardless of whether they actually watched it.
It’s a volume metric, not a quality one. A campaign can deliver millions of impressions and still convert poorly if the traffic or creative isn’t right. However, in most cases, you pay for impressions — CPM model — so it’s an important metric to check.
Use impressions to measure reach and scale, then line them up with other video ad metrics to see whether that reach actually converts.
View rate
View rate is the percentage of people who started watching your ad once it loaded on their screen. It’s your first real signal of relevance.
If you get a low view rate, it can be due to three reasons: the ad isn’t grabbing attention, the placement is poor, or the audience match is off.
For skippable pre-roll video ads, the ok number is 15–25%. Strong campaigns push the view rate past 30%.
VTR (View-Through Rate)
VTR measures the share of viewable impressions that turned into a complete view. Essentially, it tells you whether people who saw your ad actually watched it through to the end.
It combines viewability and completion into a single number, so it’s a good video ad metric to check. You’ll understand whether your creative is holding attention once it’s actually in front of someone.
Completion rate
Completion rate is the percentage of viewers who watched your ad all the way to the end. It’s a strong signal of creative quality.
However, completion rates aren’t counted the same way everywhere: YouTube counts a view at 30 seconds, Meta at 3 seconds, and TikTok at the very first frame. So, check the counting method first to understand the real performance of your video ads.
CTR (Click-Through Rate)
CTR is the percentage of viewers who clicked your ad’s CTA. Unlike view-based metrics, it measures active interest — the user acted on your ad. CTR is the standard metric to watch in any advertising campaign, so you probably know all about it.
Average watch time
Average watch time is the average number of seconds or minutes viewers spent with your ad before leaving. It shows where attention holds and where it drops off. At the RichAds ad network, we break this metric by checkpoints: start, 25%, 50%, 75%, and complete.
A short average watch time on a long ad is a clear sign to trim the creative or move your key message earlier.
Skip rate
Skip rate is the share of viewers who hit the skip button before your ad finishes. A high skip rate usually means the opening seconds didn’t hook the viewer, so it’s worth fixing the creative or trying a different approach.
Skip rate pairs well with watch-time data: you can see how many people left and exactly when they left.
Engagement rate
Engagement rate looks at how much of your video people actually watched, calculated as total watch time divided by total plays (including replays). On social platforms, it can also include likes, comments, and shares.
It’s a broad read on how much your video ad resonates.
eCPC (effective Cost Per Click)
eCPC is your actual campaign spend divided by the number of clicks you received. It’s the real price, not the bid you set going in.
This video ad metric shows you how cheaply different creatives, GEOs, or sources are actually driving clicks.
CPA (Cost Per Acquisition)
CPA is your total spend divided by the number of conversions: registrations, deposits, downloads, or whatever action your offer requires. CPA ties directly to the business outcome, so you can decide whether a campaign scales, needs optimization, or gets killed.
Post-view tracking
Post-view tracking captures conversions from people who watched your video but didn’t click right away.
Users rarely act when they first view your video ad. The pattern is often different: someone watches the ad, closes it without clicking, and later goes straight to the site or app on their own and completes the target action. That’s a post-view conversion, and it can account for up to half of all conversions.
Post-view stats available in RichAds:
- Post-View Impressions — impressions shown to people who converted afterward.
- Post-View Conversions — conversions that happened after the platform served an impression.
- Post-View Media Cost — how much you spent on those conversions (usually cents or fractions of a cent).
- Post-View CPA — the cost per post-view conversion (also typically cents or fractions of a cent).
Without post-view tracking, you’re only seeing part of the picture and likely undervaluing the performance of video ads.
What is RichAds?
Ad network for telegram ads,
high quality push and popunder ads,
domain redirect, native and display traffic source,
buy push ads at $0.005 (CPC), pop ads at $0.5 (CPM),
domain ads costs start from $1.5 (CPM), native ads — from $0.001 (CPC),
ad network offers large volumes of traffic in more than 200 geos from Tier 3 to Tier 1.
Quick video ad metrics reference table
| Metric | What it tells you |
|---|---|
| Impressions | How many times your ad was served or shown. |
| View rate / play rate | Percentage of people who started watching once the ad loaded on their screen. |
| VTR | Share of viewable impressions that resulted in a complete, viewable view. |
| Completion rate (VCR) | Percentage of viewers who watched the ad all the way through. |
| CTR | Percentage of viewers who clicked your CTA. |
| Skip rate | Share of viewers who hit the skip button. |
| Engagement rate | Total watch time divided by total plays (including replays), or likes/comments/shares divided by views on social platforms. |
| Average watch time | The average amount of time viewers spent watching your ad. |
| eCPC | Your actual spend divided by clicks. |
| CPA | Total spend divided by the number of conversions: registrations, deposits, or sales. |
Remember to read video ad metrics in combinations; an isolated number can’t tell you anything worthwhile. Some common cases:
- High VTR + low CTR → the video holds attention, but the offer or CTA isn’t compelling.
- High CTR + low conversion rate → the click promise and the landing page don’t match.
- CTR dropping while completion rate holds steady or rises → classic creative fatigue; you should swap the creative.


Performance of video ads: benchmarks by metric
Numbers only mean something next to a reference point. That’s why we gathered current video ad benchmarks pulled from the RichAds platform and industry data:
| Metric | Typical range in 2026 |
|---|---|
| Video ad viewability | 70% average across programmatic video |
| Video completion rate (overall) | 40–60% average; 60–80% counts as a good result |
| Completion rate, videos under 60 seconds | ~67–71% |
| Completion rate, 1–2 minute videos | ~56% |
| CTV completion rate | Up to ~95% (near-guaranteed watch-through) |
| YouTube skippable view rate | 15–25% baseline; 30–40%+ for strong campaigns |
| YouTube average CTR (in-stream) | ~0.65% |
| Facebook video CTR (traffic objective) | ~1.57% across industries |
| TikTok in-feed CTR | ~0.84%; TopView (sound-on) 12–16% |
| RichAds pre-roll average CTR | ~1.84% |
| Programmatic video CPM | Roughly $0.05–$1.20, depending on GEO and inventory type |
| CTV CPM | $14–$18 |
| YouTube average CPV | $0.02–$0.03 |
These figures move by GEO, vertical, device, and placement, so treat them as a reference, not a target to hit blindly. Your own trendline usually tells you more than any outside video ad benchmarks table. Check out the data this month vs. last month or this creative vs. the last one to understand the performance pattern.
What is RichAds?
Ad network for telegram ads,
high quality push and popunder ads,
domain redirect, native and display traffic source,
buy push ads at $0.005 (CPC), pop ads at $0.5 (CPM),
domain ads costs start from $1.5 (CPM), native ads — from $0.001 (CPC),
ad network offers large volumes of traffic in more than 200 geos from Tier 3 to Tier 1.
How effective are video ads?
You know the metrics and average industry numbers, but how effective are video ads compared to the rest of your media mix? The answer depends on your campaign goal:
- For viewability and reach, video wins outright. Pre-roll ads can’t be scrolled past or affected by banner blindness, so the user is bound to see them. The performance of online video ads is hard to beat for brand awareness campaigns and top-of-funnel acquisition.
- For direct, immediate clicks, video does well but isn’t your top option. Average video CTR is 1.84% on well-targeted pre-roll traffic, which beats static formats, but it still won’t match a push or pop campaign for pure click volume per dollar. That’s why the best affiliate setups combine ad formats: video introduces and warms up the audience, then a push or popunder handles the retargeting and closes the deal.
One more factor that affects video ad performance is traffic quality. Bot and invalid traffic on mobile app video inventory has climbed to roughly 39–41% in 2026, so you need a video ad network with powerful anti-fraud filtering.
RichAds positions itself as a premium advertising platform. It combines internal pattern checks with external tools like Adscore to keep traffic clean and stats trustworthy. RichAds turns its best-performing sources into separate premium traffic segments you can target directly. Ultimately, you get billions of impressions across 220+ GEOs and can be 100% sure these are real users.

RichAds pre-roll video traffic statistics
To understand how effective video ads really are, check out the real data from RichAds’ own traffic base, with impressions, CTR, and CPM broken down by country.
| Country | Impressions, monthly | CTR, % | CPM, $ |
| IND | 1.09 bln | 5 | 0.10 |
| IDN | 267 mln | 1.8 | 0.13 |
| THA | 114 mln | 2.5 | 0.17 |
| DEU | 74.6 mln | 1.8 | 0.45 |
| USA | 67.3 mln | 1.7 | 0.59 |
| VNM | 54.8 mln | 4 | 0.99 |
| BRA | 43.7 mln | 6 | 1.16 |
| TUR | 43.6 mln | 4.6 | 0.45 |
| JPN | 42.3 mln | 5.1 | 1.17 |
| MYS | 33.2 mln | 1.8 | 0.16 |
| PHL | 29.1 mln | 4.3 | 0.08 |
| FRA | 27.5 mln | 2.3 | 1.00 |
| COL | 27.4 mln | 3.8 | 0.25 |
| AUS | 23.1 mln | 2.4 | 0.93 |
| POL | 20.5 mln | 1.9 | 0.30 |
| CHN | 20.4 mln | 1.7 | 0.37 |
| BGR | 20.4 mln | 3 | 0.35 |
| PAK | 20.0 mln | 8.6 | 1.00 |
| CAN | 19.81 mln | 2.1 | 0.67 |
| BGD | 16.83 mln | 4.6 | 1.00 |

Case in point: 4.6% CTR and a $53 cost per deposit on video ads
A 30-day RichAds pre-roll campaign for a Sports Betting brand in Indonesia shows what strong video ad performance looks like:
| Metric | Result |
| Impressions | 165,000,000+ |
| CTR | 4.6% |
| eCPM | $0.15 |
| eCPC | $0.0033 |
| Win rate | 29% |
| Registrations | 9,000 |
| Cost per registration | $2.76 |
| Deposits | 468 (≈5.2% reg-to-dep) |
| Cost per deposit | $53.00 |
The campaign ran mobile-only with skippable in-stream pre-roll ads, a one-impression-per-user daily cap, and 10 isolated creatives. The team set up S2S postback tracking before launch and monitored video ad metrics closely to optimize on the go.
The pre-roll video case proves video can hit an efficient, predictable cost per deposit at real scale, but requires a knowledgeable approach to campaign management.
What is RichAds?
Ad network for telegram ads,
high quality push and popunder ads,
domain redirect, native and display traffic source,
buy push ads at $0.005 (CPC), pop ads at $0.5 (CPM),
domain ads costs start from $1.5 (CPM), native ads — from $0.001 (CPC),
ad network offers large volumes of traffic in more than 200 geos from Tier 3 to Tier 1.
How to improve video ad performance
Imagine you checked the performance of your online video ads, and it didn’t look the way you wanted it to. What should you do? Try some tips from this list provided by the RichAds ad network affiliate experts:
- Reconsider your goal. Video’s core job is to build emotion and awareness, so pushing it toward the same instant-click benchmarks as push or pop sets you up to misread perfectly good results. Recheck your metrics against the actual goals: awareness, reach, conversion, etc.
- Match the creative to the format. A video built for pre-roll needs a different visual and structure than one built for native. There is no one-size-fits-all solution.
- Win the first 3 seconds. If you see a high skip rate, your video ad doesn’t grab attention right away. Check your creatives and lead with something surprising or visually powerful.
- Keep ads to 15–20 seconds. Check your average watch time; long ads may cause viewers to leave. Your video should be short and catchy to convert better per dollar spent.
- Make the CTA unmissable. State the action early, repeat it at the end, and use clear button text like “Get Offer” or “Try Free”.
- Test creatives as separate campaigns. RichAds allows you to upload up to 5 pre-roll creatives per campaign, but isolated testing is the best way to find your true top performer.
- Set a frequency cap. One impression per user per day is a solid default. Capping prevents ad fatigue that may affect your CTR.
- Use micro-bidding by source. Bidding per individual source helps you optimize the spend, especially on broad traffic.
- Watch for fatigue signals. If CTR drops while completion rate stays flat, the audience is tired of the creative, and you should change it.
- Try a new angle. A/B testing is your best friend. Create more video ad variants with different designs, audio, characters, leads, and overall approaches. You can use AI video generation tools to simplify the creation process.
Conclusion
The performance of online video ads comes down to setting up tracking in advance and choosing the right metric for the right funnel stage. Get those things right, and video becomes one of the most reliable formats in your stack, delivering 100% viewability, strong engagement, and a high conversion rate.
Ready to experience how effective video ads can be? RichAds gives you pre-roll CPMs starting at $0.05, built-in S2S postback, and Micro Bidding and Automated Rules to keep your video ad performance on target from impression to conversion.
What is RichAds?
Ad network for telegram ads,
high quality push and popunder ads,
domain redirect, native and display traffic source,
buy push ads at $0.005 (CPC), pop ads at $0.5 (CPM),
domain ads costs start from $1.5 (CPM), native ads — from $0.001 (CPC),
ad network offers large volumes of traffic in more than 200 geos from Tier 3 to Tier 1.

FAQ
Match your metrics to your goal. For awareness, track impressions, viewability, and VTR. For clicks, track CTR and engagement rate. For conversions, track conversion rate and cost per acquisition.
The RichAds ad network experts note that you should look at metrics in combinations. For example, if you see high VTR but low CTR, the problem isn’t with the video; the offer or CTA isn’t compelling enough.
Anywhere from 40–60% is an ok result; 60–80% is considered strong. Short videos usually have a higher completion rate, around 67–71%, while videos running 1–2 minutes tend to drop to around 56%.
Non-skippable in-stream video ads deliver the highest completion rate — close to 95% — since viewers have to watch to the end.
Video ad benchmarks vary heavily by platform and targeting. YouTube in-stream ads average around 0.65% CTR, Facebook video traffic averages around 1.57%, and RichAds pre-roll traffic can average 1.84% or even higher. Some markets see CTRs of 4–8%+.
It depends on the campaign goal. For viewability and engagement, video is the top performer. It avoids banner blindness and holds attention longer. For raw click volume per dollar, banners and push notifications can still win.
On the RichAds ad network, most affiliates get the best results by using video to build awareness first, then closing with a high-frequency format like push or pop ads.
Test more angles, lead with a hook, keep video short, and use a clear CTA. Depending on your actual video ad metrics, you may also need to cap impressions per user or reconsider targeting.











 Latest articles