Es
Es



You’ll learn:
- 8 video ad formats, with pros and cons of each;
- 4 video traffic sources for white-hat, grey, and black verticals;
- Complete video marketing statistics, with traffic volumes and ad spend across the platforms;
- Top 20 GEOs for iGaming video advertising
- Current video creative trends, including AI generative approaches.
What Is Video Advertising: A Breakdown of Formats
First, let’s clean up the terminology so the naming doesn’t get confusing. We’ll use three classifications:
- By placement — where the video physically shows up: in-stream (inside a video player) vs. out-stream (outside video content — in an article/feed/banner).
- By position in the viewing session — when the video shows up: before the main content — pre-roll, in the middle — mid-roll, or after it — post-roll (relevant only for in-stream).
- By user engagement model — rewarded video (the publisher gets paid a reward for the view), interstitial video (the video opens full-screen), and native video (it blends into the content).
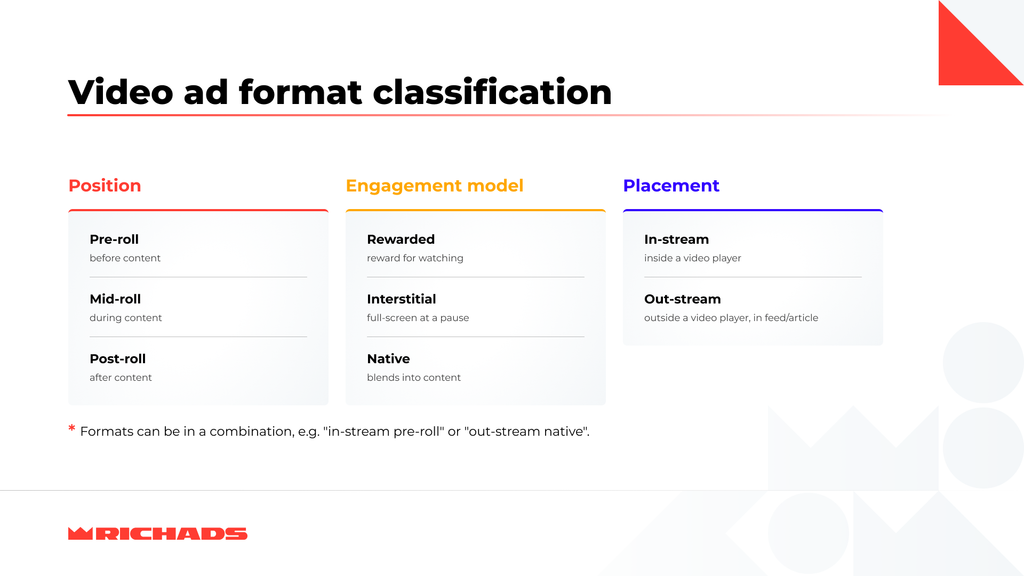
You can combine these terminologies into compound format names — for example, “in-stream pre-roll” or “out-stream native”.


Below, you can check which format fits your task. For now, it’s abstract — no volumes, costs, or conversions yet.
| Format | Where it runs | Launch trigger | Pros | Cons |
|---|---|---|---|---|
| In-Stream | Video players, streaming services, video hosting sites | Built into the player, launches with the content | High user attention; VAST/VPAID support gives tracking and interactivity flexibility; premium format perception | Requires the publisher to have video content; higher buying cost; user can close/skip the ad |
| Out-Stream | Articles, social feeds, banner zones on sites without video | Auto-plays when it enters the viewport (in-view triggering), usually on scroll | Huge available inventory (any site, not just video platforms); cheaper than in-stream; scalable reach | Usually muted by default — lower engagement; higher non-viewability risk; easy to lose among the content |
| Pre-Roll | Start of in-stream video, before the main content | Auto-plays before playback starts | Maximum reach and forced-view; the user hasn’t gotten their content yet — high motivation to watch through/react | Annoys the user if the ad is long; high skip/close rate at the first opportunity; competition for the first few seconds of attention |
| Mid-Roll | Middle of long in-stream video (breaks in streams, content splits) | Triggers at a preset pause point in the content | High completion — the user’s already invested and doesn’t want to leave; feels less intrusive than pre-roll | Needs long-form content (~8–10 min+) — limited inventory; bad placement can annoy at a climactic moment |
| Post-Roll | End of in-stream video, after the content wraps | Plays after viewing finishes | Lowest buying cost; doesn’t interrupt the main viewing | Lowest completion rate — the user’s usually already gone; minimal effectiveness for performance goals |
| Rewarded Video | Mobile games and apps | Voluntary click in exchange for a reward (extra life, in-game currency, feature unlock) | Very high completion rate (often 90%+); positive ad perception — a deal, not an interruption; quality, “warm” lead | Narrow inventory (gaming apps only); doesn’t work for cold reach; depends on the publisher’s game mechanics |
| Interstitial Video | UI pauses in apps/sites (between levels, screen transitions) | Auto-shown at a natural pause in interaction | Good balance of reach and attention; full-screen format — high visibility; not tied to having video content | Can feel intrusive if triggered too often; risk of accidental clicks |
| Native Video | News feeds, recommendation blocks, content widgets | Auto-plays on scroll, styled to match surrounding content | Less banner blindness; organic placement boosts CTR; soft, non-intrusive funnel entry | Lower direct performance vs. pre-roll; needs solid creative adaptation to the placement’s style; risk of being mistaken for organic content (reputation risk) |
What is RichAds?
Ad network for telegram ads,
high quality push and popunder ads,
domain redirect, native and display traffic source,
buy push ads at $0.005 (CPC), pop ads at $0.5 (CPM),
domain ads costs start from $1.5 (CPM), native ads — from $0.001 (CPC),
ad network offers large volumes of traffic in more than 200 geos from Tier 3 to Tier 1.

Where to Buy Video Advertising?
Now that the terms and format names are sorted, the next question is: where do you actually buy the ads, and who do you ask for pricing to put together your media plan?
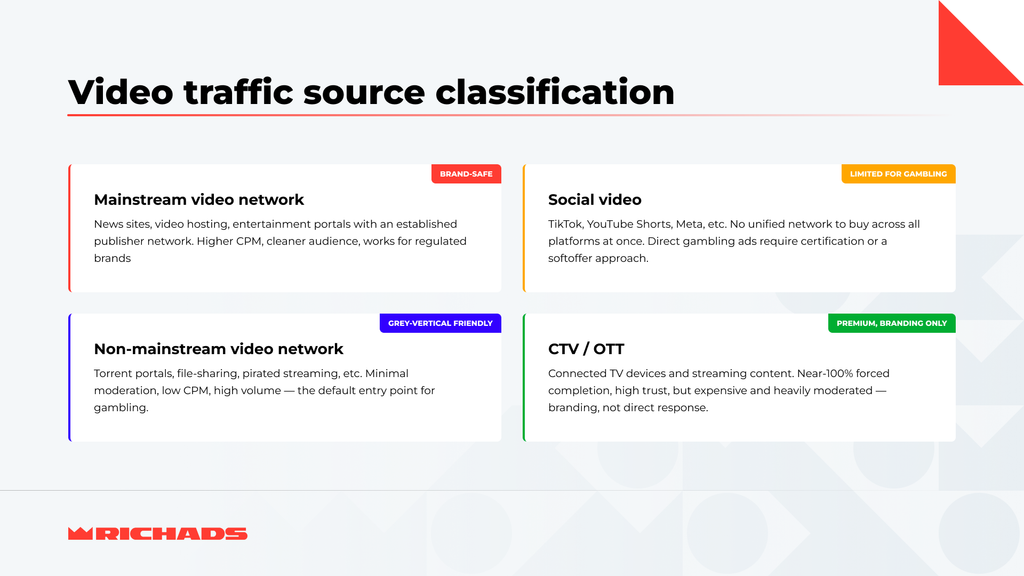
Broadly speaking, there are four main sources of video inventory:
- Mainstream video network. Since buying impressions site by site is a nightmare, you need a network with an already-built publisher base: regular sites, video hosting platforms, news portals, entertainment sites, and so on. Safe for white-hat, compliant brands.
- Non-Mainstream video network. Same idea as above, except the traffic comes from publishers like torrent sites, file-sharing platforms, VPN apps, pirated content streaming, and so on — basically all the non-premium video inventory that suits grey verticals.
- Social Video. Video within social platforms like TikTok, YouTube Shorts, Meta, etc. Each platform has its own odds with moderation and ad account setup, and there’s still no single network that can run universal creatives everywhere at once. So you’re either hunting for half-measure workarounds through various DSPs, or opening an ad account on every platform and running campaigns separately — at least, there is a lot of traffic. Doesn’t work for most grey and for all black verticals.
- CTV/OTT. This one needs a bit of explanation:
CTV (Connected TV) = the device you watch on (Apple TV, Chromecast, an ISP set-top box, a console like PlayStation).
OTT (Over-The-Top) = the service/content you’re watching (Netflix, YouTube, Kinopub, etc.).
To buy impressions there, you go to specialized agencies and big DSPs — starting budgets are higher than all the other options above, and moderation is strict.
A separate note on YouTube: watching through the app on a TV counts toward CTV stats, while watching through the mobile feed/Shorts counts toward Social stats. Keep all these nuances in mind for the numbers below.

Let’s put all the sources into a comparison table and add formats and verticals:
| Source | Formats | Verticals | Pros | Cons |
|---|---|---|---|---|
| Non-Mainstream (pirated streaming, torrents, alt-apps, etc.) | Pre-roll, Out-stream, Interstitial | iGaming, Betting, Dating, Nutra | Minimal moderation, low CPM, high traffic volumes, fast launch | Risk of low-quality/bot traffic without whitelists, lower user trust, brand reputation risk |
| Mainstream Video Networks (video hosting, news portals, streaming) | Pre-roll, Mid-roll, Out-stream | iGaming, Betting, Finance, E-commerce, Utilities, Games | Quality, “clean” audience, higher click conversion, access to mid-roll with high completion | Higher CPM, longer creo/lander moderation, limited access for aggressive creatives |
| Social Video (TikTok, Meta, YouTube Shorts) | Native video, Out-stream, Rewarded (in-app) | E-commerce, Finance, Dating, Games, Utilities | Massive reach and precise targeting, high audience engagement, powerful platform creative tools | Strictest policy on gambling/betting (needs certification or a soft-offer approach), high account ban risk |
| CTV/OTT (Netflix, Roku, YouTube App, Amazon Fire TV, etc.) | Pre-roll, Mid-roll (in-stream only) | Finance, E-commerce, Betting (branding), Games | Almost 100% completion, premium brand perception, high audience trust | Expensive, no direct click from the remote, tough moderation — not for direct gambling creo, branding only |
What is RichAds?
Ad network for telegram ads,
high quality push and popunder ads,
domain redirect, native and display traffic source,
buy push ads at $0.005 (CPC), pop ads at $0.5 (CPM),
domain ads costs start from $1.5 (CPM), native ads — from $0.001 (CPC),
ad network offers large volumes of traffic in more than 200 geos from Tier 3 to Tier 1.
Video Marketing Statistics
The main goal of this section is to figure out what’s happening with these sources in terms of traffic volumes and budget — where the audience is growing, and where advertisers are spending more.
Getting solid numbers here is hard: every source uses its own methodology for counting views due to tech differences. On top of that, the leading stats firms often only crunch numbers for one region, which doesn’t give you the global picture and makes comparisons messy.
Let’s dig in together.
CTV/OTT
For this source, the most reliable data I found was for the US market, so we’re treating it as the global trend. Growth rates were compared from 2024 through 2026 (partial year) across three metrics: time spent, invalid traffic, and ad spend.
Bottom line — all three metrics are growing, but ad spend and time spent growth are slowing down, unlike bot traffic. Here’s the data:
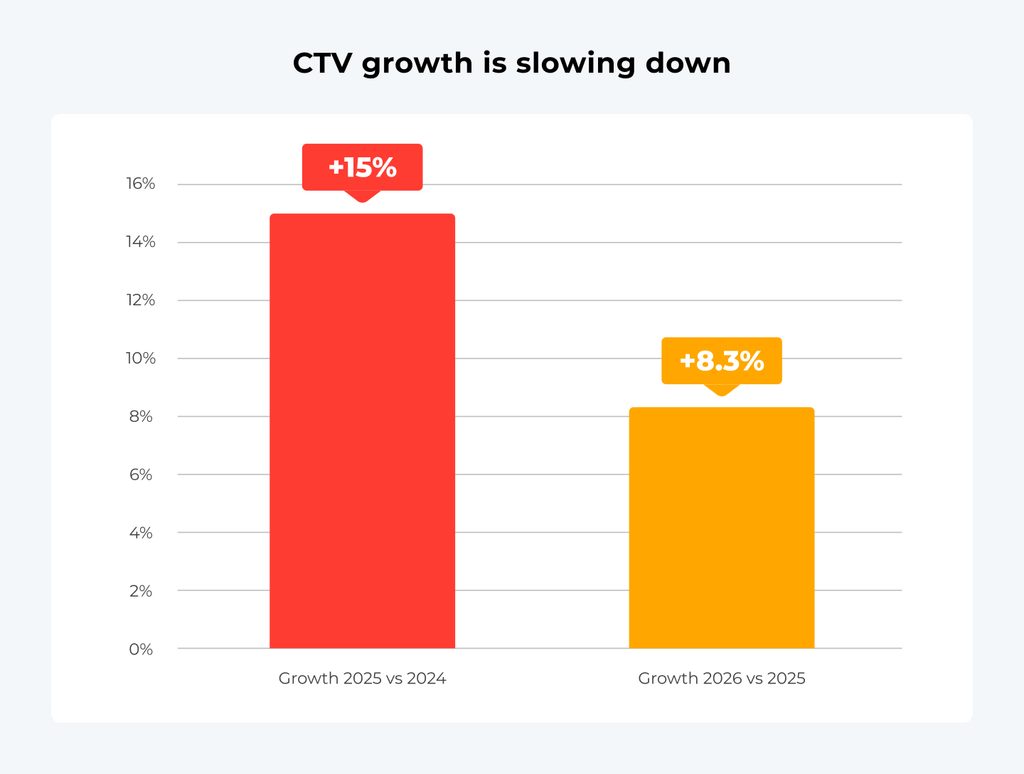
- Time spent – how much time people spend watching content. Research shows growth slowing to 8.4% in 2026 vs. 2025, compared to 15% in 2025 vs. 2024. The market is moving from explosive growth into maturity.
Worth noting that the data covers dozens of platforms, and their growth rates vary wildly. Some individual players, like Prime Video and Roku, are still growing 25–32% YoY, massively outpacing the market as a whole.
Fun fact: in March 2026, Nielsen delayed publishing its February report because the household TV-connection growth numbers came in lower than the streaming companies wanted — so they “leaned on” Nielsen to keep it from going out.
- IVT = Invalid Traffic, or plain old bot traffic. Pixalate’s data shows a 19% jump in 2025 vs. 2024, and Q1 2026 vs. Q1 2025 shows 25% — a record high.
- Ad spend on CTV grew from $28.79B in 2024 to $33B in 2025, according to eMarketer, with a forecast of $37.70B in 2026 — that’s 19%-16%-13% YoY growth, respectively.

Social Video
This category includes a bunch of individual private companies that don’t disclose their numbers, and since there’s no single platform to analyze them through, I have a few disclaimers on the stats below.
We’re looking at the three biggest social platforms — YouTube, TikTok, and Meta — across audiences, fake accounts, and ad spend.
TikTok and YouTube don’t regularly publish official global audience numbers, and Meta stopped disclosing its share of fake accounts altogether back in 2023.
The numbers below were pulled from third-party sources and can have a significant spread in their ranges.
| Audience / MAU | 2024 | 2025 | 2026 forecast |
|---|---|---|---|
| YouTube (Alphabet doesn’t disclose MAU in its reports — only ad revenue. Figures are unofficial estimates from DataReportal/Statista/Backlinko) | ~2.40–2.50B | ~2.53–2.70B (+6.7%) | ~2.70–2.85B (+6.1%) |
| TikTok (ByteDance is private — there’s no official data at all. All figures are third-party estimates from Backlinko, DemandSage, Dreamgrow, etc.) | ~1.50–1.70B | ~1.6–2.2B (+6.6%–29%) | ~1.0–2.2B (-40%–0%) |
| Meta (Official quarterly reports since 2024 cover DAU only — investor.atmeta.com. We’re extrapolating that to MAU, even though it’s not 100% accurate) | ~3.35B | ~3.58B (+6.8%) | ~3.72B (+4%) |
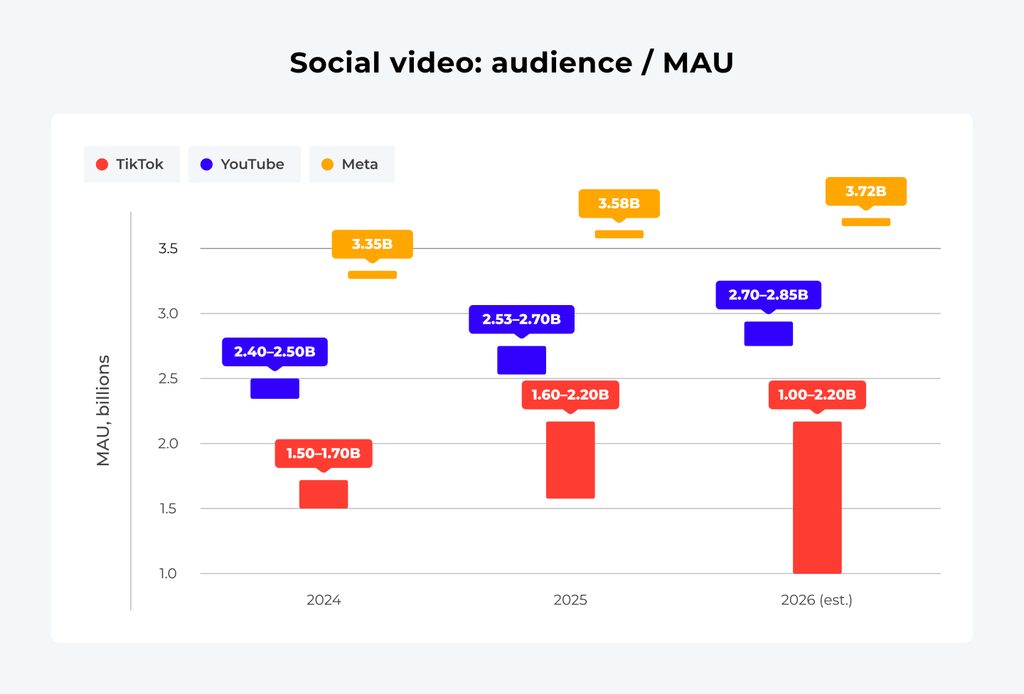
YouTube shows the most stable and predictable trajectory of the three — growth is holding at 6–7% YoY.
Meta’s audience growth is slowing — from +6.8% down to +4% over three years — but it’s still the only platform with fully official, verifiable data.
TikTok is the only platform where you genuinely can’t draw a solid conclusion, since the estimated spread is too wide and none of the data is official.
| Ad spend / avg. Monthly | 2024 | 2025 | 2026 forecast |
|---|---|---|---|
| YouTube (Official Alphabet data, public company, SEC filings) | ~$3.01B | ~$3.36B (+11.8%) | ~$3.29B (+11%) |
| TikTok (NO official data — all figures from third-party analytics firms like DemandSage, Growth Navigate, etc.) | ~$1.97B | ~$2.76B (+40.5%) | ~$2.90–3.66B (+5%–31%) |
| Meta (Official data — SEC-regulated filings, direct Meta press releases) | ~$13.71B | ~$16.75B (+22%) | ~$20.27B (+28%) |
The most reliable numbers come from YouTube, and they show the most modest, predictable growth of ~11–12%.
There’s no official TikTok data, and that’s the one showing the most impressive growth at ~25–40%, which can’t be verified.
Meta sits in between: fully official data and accelerating revenue growth, pointing to a strategy focused on monetizing its existing base rather than acquiring new users.
| Fake accounts, avg. removed per year | Ratio (removed / MAU) | |
| YouTube | ~25M spam channels | ~42% |
| TikTok | ~1B | ~53% (more than half the audience) |
| Meta | ~4.5B | ~147% (more than the MAU figure itself!) |
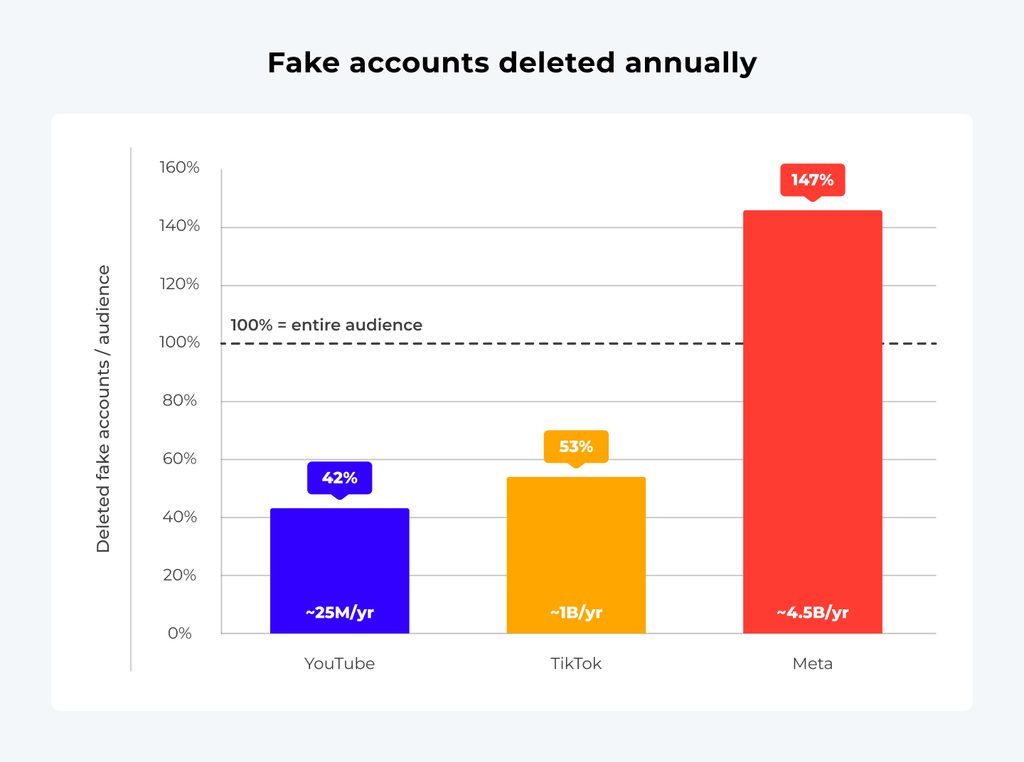
Meta has the highest account-removal rate: either they’re dealing with a massive bot attack, or they run the most aggressive detection system.
Mainstream Video Network and Non-Mainstream Video Network
Impressions
Just about all the video inventory sits across roughly 15–20 networks and DSPs. Add up the numbers each of them claims publicly, and you get about 100 billion impressions per day. That equals showing every person on Earth a video ad 12 times a day. Sounds not real.
Why this number can’t actually be calculated:
- In the programmatic ecosystem, the same piece of inventory can pass through multiple intermediaries at the same time;
- Differences in who’s reporting what: “impressions processed” ≠ impressions sold — the former is the entire volume of ad requests/bid requests that technically passed through the network’s/DSP’s infrastructure, including a huge chunk of “empty” requests that never won an auction;
- The same publisher works with several networks at once and sometimes sells the same slot to different networks at different times of day or rotates between them;
- Almost everyone inflates their numbers or just forgets to update the ones already posted on their own sites and their partners’ sites.
So while you can’t calculate the total impression volume across all networks, there are big SSPs and DSPs that are required to disclose their financials, and you can pick up some clues there. However, public, white-hat companies don’t carry non-mainstream traffic.
- PubMatic (Nasdaq: PUBM) — works with roughly 1,950 major publishers and app developers. Processed impression volume grew from ~75 trillion per quarter (Q1 2025) to ~94.2 trillion (Q1 2026) — 26% YoY growth. Keep in mind: processed impressions ≠ real/sold impressions.
- The Trade Desk (Nasdaq: TTD) — the largest independent DSP — shows video spend volume growing roughly +24% YoY. Another indirect signal of growth.
What is RichAds?
Ad network for telegram ads,
high quality push and popunder ads,
domain redirect, native and display traffic source,
buy push ads at $0.005 (CPC), pop ads at $0.5 (CPM),
domain ads costs start from $1.5 (CPM), native ads — from $0.001 (CPC),
ad network offers large volumes of traffic in more than 200 geos from Tier 3 to Tier 1.
Invalid Traffic
Here’s everything we could dig up from open sources. Note that the mobile traffic numbers below also apply to the social source.
| Period | Web | Mobile App | CTV (for comparison) |
|---|---|---|---|
| Q2 2025 (Pixalate Q2 2025 Global Ad Fraud Benchmarks) | 19% | 29% | 18% |
| Q3 2025 (Pixalate Q3 2025 Global IVT & Ad Fraud Benchmarks) | 21% | 33% | 19% |
| Q1 2026 (Pixalate Q1 2026 Ad Fraud Benchmarks Report for EMEA/North America) | 20% | 39% | 25% |
| Q2 2026 (Pixalate Q2 2026 Ad Fraud Benchmarks Report for EMEA/North America) | 21% | 41% | 26% |
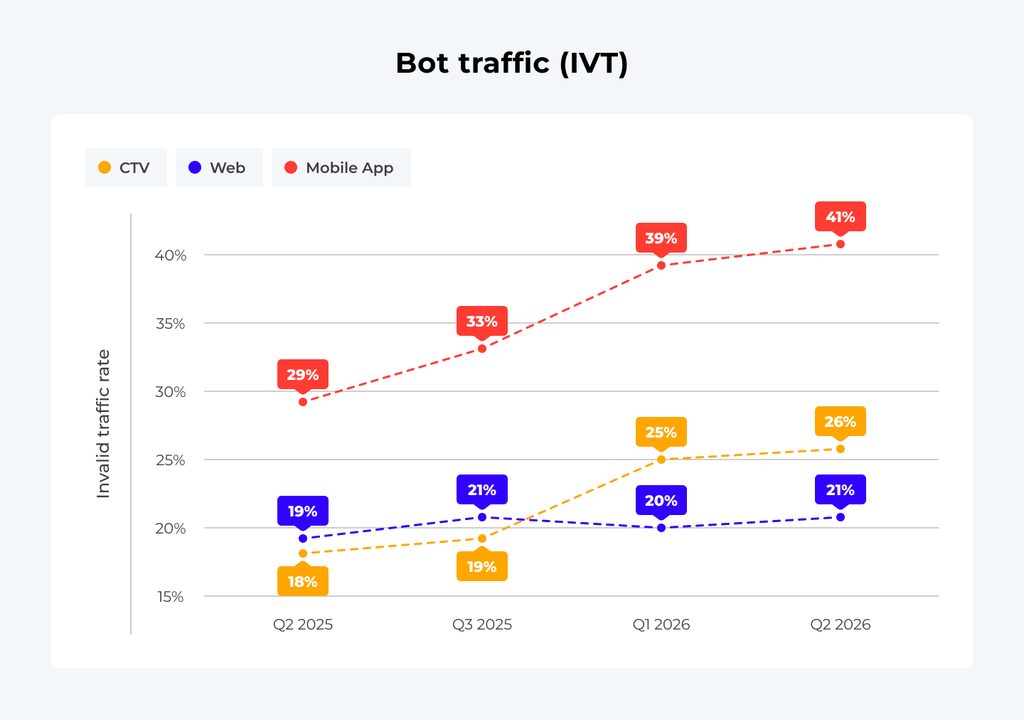
One possible reason fraud is lower on the web than on mobile: the web is a well-oiled, mature part of the industry. JS-based verification, browser fingerprinting, CAPTCHA, and cookie-based tracking — these have been around for decades, which pushed fraudsters toward other areas.
Mobile video advertising is the fastest-growing segment by budget, so there’s more profit in it for everyone.
And CTV, by the way, has 26% fraud growth — higher than the web, but lower than the app. Basically, it’s a middle ground: not as strong protection as the web, and impression prices are high enough to make fraud worth the effort.

RichAds Platform Data
One thing we can do for certain — pull real numbers from the RichAds platform and look at them from several angles of advertiser performance.
RichAds works across a range of verticals: iGaming, Finance, Nutra, Utilities, Games, and Ecommerce. However, most benchmarks have been collected for iGaming, so that’s where we’ll dig in.
Top 20 countries by impressions, with CTR and CPM, for the iGaming vertical
| Country | Impressions, monthly | CTR, % | CPM, $ |
| IND | 1.09 bln | 5 | 0.10 |
| IDN | 267 mln | 1.8 | 0.13 |
| THA | 114 mln | 2.5 | 0.17 |
| DEU | 74.6 mln | 1.8 | 0.45 |
| USA | 67.3 mln | 1.7 | 0.59 |
| VNM | 54.8 mln | 4 | 0.99 |
| BRA | 43.7 mln | 6 | 1.16 |
| TUR | 43.6 mln | 4.6 | 0.45 |
| JPN | 42.3 mln | 5.1 | 1.17 |
| MYS | 33.2 mln | 1.8 | 0.16 |
| PHL | 29.1 mln | 4.3 | 0.08 |
| FRA | 27.5 mln | 2.3 | 1.00 |
| COL | 27.4 mln | 3.8 | 0.25 |
| AUS | 23.1 mln | 2.4 | 0.93 |
| POL | 20.5 mln | 1.9 | 0.30 |
| CHN | 20.4 mln | 1.7 | 0.37 |
| BGR | 20.4 mln | 3 | 0.35 |
| PAK | 20.0 mln | 8.6 | 1.00 |
| CAN | 19.81 mln | 2.1 | 0.67 |
| BGD | 16.83 mln | 4.6 | 1.00 |

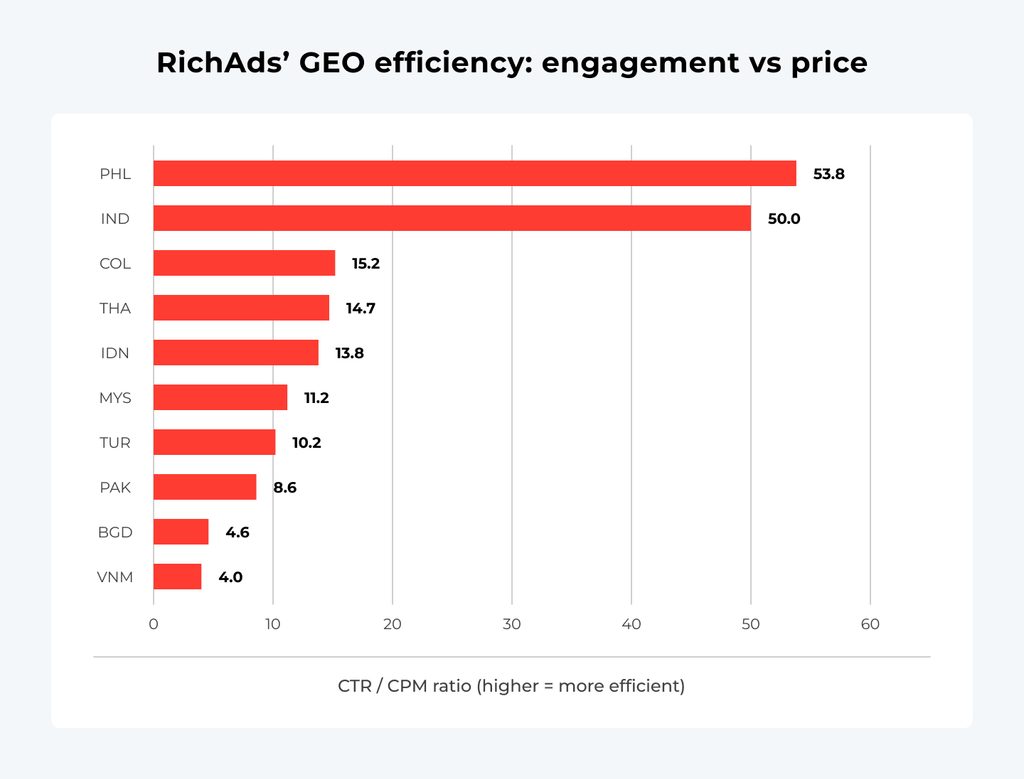
So what advice can we give media buyers looking at these numbers?
Underpriced markets — high CTR at low CPM
Audience engagement in these GEOs is clearly higher than what the current price “justifies” — meaning advertiser competition hasn’t caught up to the traffic quality yet:
- PHL (Philippines) — 4.3% CTR at a CPM of just $0.08. The engagement-to-price ratio here is the best in the whole table — noticeably better than even India’s. This should be the first pick for testing.
- TUR (Turkey) — 4.6% CTR at a $0.45 CPM, while GEOs with similar CTR (JPN, BRA) run CPMs almost 2–3x higher. Looks like a market that competition hasn’t “warmed up” yet.
- COL (Colombia) and IDN (Indonesia) fall into this bucket too: decent CTR at a CPM that’s a fraction of what Tier-1 countries with similar engagement charge.
- IND (India) — a massive volume (1.09B impressions) at a $0.10 CPM with a solid 5% CTR — a great spot for racking up volume fast and testing creatives at scale. But cheap Tier-3 traffic in gambling often runs into trouble at the deposit stage — use this volume for A/B-testing creatives/landers, not as your main ROI source, without first checking how the funnel performs all the way to FTD.
Pricier markets with weak CTR — proceed-with-caution zone
DEU, USA, FRA, AUS, CAN — all sit at a 1.7–2.4% CTR, but CPMs of $0.45–1.00 — noticeably higher than GEOs with similar or even better CTR. There are two possible explanations here, and the buyer needs to figure out which one applies to their specific offer:
- Positive scenario: these are high-spending Tier-1 markets — the low CTR is offset by much higher lead quality and deposit value, so the premium is justified.
- Negative scenario: the high price is simply a byproduct of heavy competition, not real audience quality in the vertical.

From Impression to FTD: The Video Ad Funnel in Gambling
| Funnel Stage | Traffic Problem Zone | How RichAds Closes It | RichAds Tools |
|---|---|---|---|
| Impression | Bot traffic inflates impression counts — money goes toward viewers who don’t exist (we covered this: mobile app IVT hit 39–41%) | Filters out invalid traffic before it ever hits your campaign stats | Layered anti-fraud system + whitelisted publishers |
| View → Click | Completion rate — watching the ad through doesn’t mean it registered with the viewer. CTR is what measures actual activity. | Optimizes delivery not for “watch-through”, but for real performance signals from each specific placement | AI Optimizer, Microbidding (bids set at the source level) |
| Click → Registration | No tracking from click to registration means no way to optimize | Passes the actual registration event back into the system, not just the click | S2S Postback |
| Registration → FTD | A registration isn’t a deposit yet: without a follow-up touch, users tend to just forget to deposit — and the budget spent acquiring them goes to waste. | Brings down the cost of registration itself and improves its quality; re-serves ads to that warm, already-registered audience, improving the odds they make it to FTD | CPA Goal (Target CPA on registration), Smart Retargeting |
Check out our real-life Betting case on pre-roll ads in Indonesia to understand video traffic efficiency. RichAds ran a 30-day pre-roll video campaign for a Betting brand in Indonesia. The client wanted to grow reach aggressively while keeping cost per deposit predictable and low. As a result, the testing drove 165M+ impressions, 9,000 registrations, and 468 deposits at a $53 cost per deposit. The high CTR of 4.6% at just $0.0033 eCPC — proof that pre-roll can scale volume aggressively without sacrificing quality in competitive verticals.
Which client segments get the most value from running pre-roll video traffic on RichAds:
- Segment 1. Operators entering new Tier-2 and Tier-3 markets.
When you don’t need to build brand awareness from scratch, but you do need fast, massive, cheap reach in markets where pricing hasn’t fully heated up yet. - Segment 2. Operators/media buyers testing creos and hypotheses at scale.
It’s not about the quality of each impression — it’s about volume, so you can run dozens of fast tests in days instead of months. GEOs like India give you massive volume at a low price. - Segment 3. Established brands buying up Tier-1.
When lead quality matters more than a high CTR and a low CPM. - Segment 4. Media buyers who need full-service support from the platform.
The RichAds team is ready to help with end-to-end launches, testing, results analysis, and creative production.
What is RichAds?
Ad network for telegram ads,
high quality push and popunder ads,
domain redirect, native and display traffic source,
buy push ads at $0.005 (CPC), pop ads at $0.5 (CPM),
domain ads costs start from $1.5 (CPM), native ads — from $0.001 (CPC),
ad network offers large volumes of traffic in more than 200 geos from Tier 3 to Tier 1.
Creative Trends
Before you launch another video creative on gambling traffic across ad networks, keep these already-active trends in mind:
1. AI detection of generative-creative “fingerprints”
Say a video was generated by any AI (Sora, Runway, and the like). Each of these tools has its own signature “fingerprint” — textures, how light behaves, how physical objects move — and moderation platforms are already picking up on it and drawing conclusions. Meta has this capability, and I think it’s going to get used more and more against grey and black verticals.
2. AI as an “insight engine”, not just a generator
The more mature approach to video generation isn’t building every ad from scratch — it’s analyzing your existing library of creatives (comparing visual and audio traits like color, whether there’s a face on screen, length, composition, voiceover), measuring their performance, and reworking them into new tests. Big brands can do this through dedicated analytics tools (VidMob, Meta Creative Insights); affiliates without a big budget will have to do it manually with spreadsheets and accessible AI video tools.
3. AI optimization on the publisher’s side
Publishers have begun using AI to test ad placement, pricing, and timing in real time, and some report revenue gains of 20–30% from automation alone. This directly drives the emergence of new video ad formats and makes them either more or less expensive, which translates into better conversion for the advertiser.
There are already news sites running vertical video feeds baked right into the page layout — a permanent section the user scrolls through vertically, like in TikTok.
4. The arms race in creo production volume
The industry is clearly moving away from the “one great ad” mindset toward high-frequency testing of dozens of variations. This is explained by every point above. AI ad generators crushed production costs — the barrier that used to naturally cap volume is gone. Platform algorithms push you toward this approach themselves, through creative fatigue, market-by-market personalization, endless testing, and so on. And all of that leads to audience fatigue with your creative, which means you need to make even more and be even louder.

Key Takeaways
Video advertising in 2026 isn’t about one single format — it’s a whole ecosystem made up of four fundamentally different buying sources: Mainstream and Non-Mainstream video networks, Social Video, and CTV/OTT, each growing on its own with its own audience, pricing, and moderation level for the gambling vertical.
Independent data shows that the explosive growth we saw in 2024 and 2025 has started to slow across every segment — from 15% down to 8.4% for CTV time spent, and from 6.8% down to 4% for Meta’s audience — while bot traffic, by contrast, keeps climbing steadily and is already hitting 39–41% on mobile apps.
At the same time, video advertising specifically is becoming one of the key monetization formats in the programmatic market: video’s share of revenue at major SSPs and DSPs is closing in on half of all ad budgets.
For a media buyer in gambling, this means the choice of traffic source shouldn’t be driven by general trends, but by the specific job at hand — Non-Mainstream for fast, cheap testing, Mainstream for cleaner audiences, CTV for branding when you’ve got a license and a big budget.
Just as important is pairing the right format with the right funnel stage: pre-roll works best for reach, native for driving clicks, and what actually determines conversion to FTD isn’t the creo or the targeting — it’s a properly set up postback and optimization toward your target conversion cost.
The practical solution for running video campaigns in gambling is RichAds. The platform gives you access to whitelisted Mainstream inventory with anti-fraud filtering, flexible targeting by GEO and device, and tools like S2S Postback, Smart Retargeting, and Target CPA, which close exactly the measurement gaps that most often eat into a buyer’s budget between the impression and the deposit.
What is RichAds?
Ad network for telegram ads,
high quality push and popunder ads,
domain redirect, native and display traffic source,
buy push ads at $0.005 (CPC), pop ads at $0.5 (CPM),
domain ads costs start from $1.5 (CPM), native ads — from $0.001 (CPC),
ad network offers large volumes of traffic in more than 200 geos from Tier 3 to Tier 1.

FAQ
These are two different classifications — same principle as in-stream/out-stream. “Video” refers to moving images; “interactive” concerns whether the user can engage with the ad. A video can be both static and interactive (think VPAID with clickable overlays, CTA buttons over the ad, shoppable elements).
The confusion usually comes up with interstitial: it belongs to the same group as rewarded and native — user engagement model, not content type. So an interstitial can be implemented as video, as a static image, or as an HTML5 banner — the full-screen placement itself isn’t tied to video specifically.
To deliver emotion and build awareness faster than a static format (banner, push) can. You physically can’t “scan” a video in a split second the way you can a banner — so it works better at the top of the funnel (reach, brand awareness), not as a direct trigger for clicks and conversions. Expecting the same direct-response metrics from video that you get from push/pop is a methodology mistake — they’re different tools for different funnel jobs.
It’s not creative or targeting — it’s correctly passing the conversion signal back into the system via postback. Optimization algorithms (AI Optimizer, CPA Goal, and similar tools) learn from real data — if the system can’t see which impressions actually led to an FTD, it physically can’t route the budget toward what’s actually working. Setting up your postback correctly is the fastest lever there is, and it often moves the needle more than weeks of creative testing.
The classic combo in gambling is video for reach and brand introduction (top of funnel) + push/pop for cheap repeat touches and reminders (retargeting the audience that’s already seen you). Video is more expensive per contact than push, so it’s inefficient to run it at every funnel stage. The logical flow: video → warm audience → push/native as the cheaper closing tool.
When CTR starts dropping while completion rate stays flat or even climbs — that’s the classic signal of creative fatigue (same principle we covered in the AI and production-volume section). The audience is sick of the ad, but it’s still forced to watch it through because the format is non-skippable. Monitor these video ad metrics closely to catch the moment early.
Technically, you can run one video everywhere. Still, each format “lives” in a different visual context: native needs to blend into the placement’s surrounding content, while pre-roll is competing for attention in the first few seconds of forced viewing. One universal video usually delivers a mediocre result everywhere, instead of a great result in at least one place.











 Latest articles